
File:Torus illustration.png
Size of this preview: 640 × 422 pixels.
| |
This is a file from the Wikimedia Commons. Information from its description page there is shown below.
Commons is a freely licensed media file repository. You can help. |
|
|
This chart was created with MATLAB. |
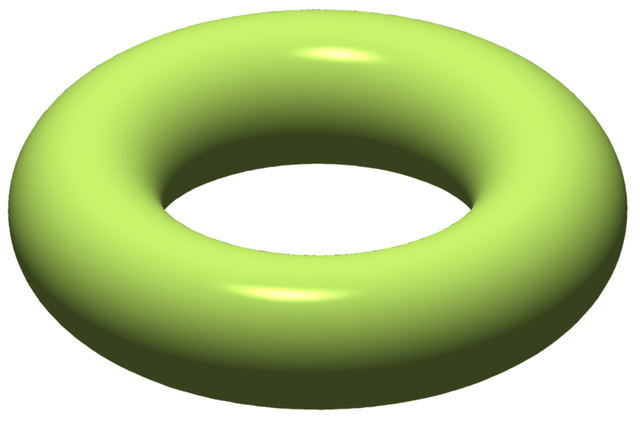
| Description | Illustration of torus |
| Date | 01:12, 13 July 2008 (UTC) |
| Source | self-made, with MATLAB |
| Author | Oleg Alexandrov |
 |
I, the copyright holder of this work, release this work into the public domain. This applies worldwide. In some countries this may not be legally possible; if so: I grant anyone the right to use this work for any purpose, without any conditions, unless such conditions are required by law.
|
 |
This math image could be recreated using vector graphics as an SVG file. This has several advantages; see Commons:Media for cleanup for more information. If an SVG form of this image is already available, please upload it. After uploading an SVG, replace this template with {{ vector version available|new image name.svg}}. |
Source code
% illustration of a torus, obtained as an isosurface
function main()

   % big and small radii of the torus
   R = 3; r = 1;

   Kb = R+r;

   h = 0.1; % h is the grid size. Smaller h means prettier picture.

   X = (-Kb-h):h:(Kb+h);   m = length(X);
   Y = (-Kb-h):h:(Kb+h);   n = length(Y);
   Z = (-r-h):h:(r+h);     k = length(Z);

   W = zeros(m, n, k); % the zero level set of this function will be the desired shape

   for i=1:m
      for j=1:n
         x = X(i);
         y = Y(j);
         W(i, j, :) = (sqrt(x^2+y^2)-R)^2 + Z.^2-r^2; % torus eqn, vectorize in Z
      end
   end

   figure(4); clf; hold on; axis equal; axis off;

   H = patch(isosurface(W, 0));
   isonormals(W, H);

   light_green=[184, 224, 98]/256;

   % set some propeties
   set(H, 'FaceColor', light_green, 'EdgeColor','none', 'FaceAlpha', 1);
   set(H, 'SpecularColorReflectance', 0.1, 'DiffuseStrength', 0.8);
   set(H, 'FaceLighting', 'phong', 'AmbientStrength', 0.3);
   set(H, 'SpecularExponent', 108);

   daspect([1 1 1]);
   axis tight;
   colormap(prism(28))

  % viewing angle
   view(-146, 32);

  % add in a source of light
   camlight (-10, 54); lighting phong;

  %save as png
  print('-dpng', '-r400', sprintf('Torus_illustration.png'));
File usage
The following pages on Schools Wikipedia link to this image (list may be incomplete):
A background to Schools Wikipedia
Schools Wikipedia has been carefully checked to give you the best learning experience. SOS Childrens Villages helps those who have nothing and no one, giving them back the famly they have lost and bringing them the very best opportunities for a happy, healthy future. Would you like to sponsor a child?