  | 
          
            This is a file from the  Wikimedia Commons. Information from its  description page there is shown below.  Commons is a freely licensed media file repository.  You can help. 
           | 


             | 
            File:Greenhouse gas by sector 2000.svg is a vector version of this file.  It should be used in place of this raster image when superior. 
             
            File:Greenhouse Gas by Sector.png     File:Greenhouse gas by sector 2000.svg  
             
            For more information about vector graphics, read about  Commons transition to SVG.  There is also  information about MediaWiki's support of SVG images. 


            | 
           
            
            | 


           | Description | 
           Se below | 
          
          
           | Date | 
           
            | 
          
          
           | Source | 
           Own work | 
          
          
           | Author | 
            Robert A. Rohde | 


        Summary 
        English: This figure shows the relative fraction of man-made  greenhouse gases coming from each of eight categories of sources, as estimated by the  Emission Database for Global Atmospheric Research version 3.2, fast track 2000 project  . These values are intended to provide a snapshot of global annual greenhouse gas emissions in the year 2000. The top panel shows the sum over all man-made greenhouse gases, weighted by their  global warming potential over the next 100 years. This consists of 72%  carbon dioxide, 18%  methane, 8%  nitrous oxide and 1% other gases. Lower panels show the comparable information for each of these three primary greenhouse gases, with the same coloring of sectors as used in the top chart. Segments with less than 1% fraction are not labeled.
        
        עברית: תמונה זו מראה את החלוקה היחסית של פליטות גזי חממה מעשה ידי אדם, על פי 8 קטגוריות של מקורות, כפי שהדבר מוערך על ידי  w:Emission Database for Global Atmospheric Research version 3.2, fast track 2000 project  . 
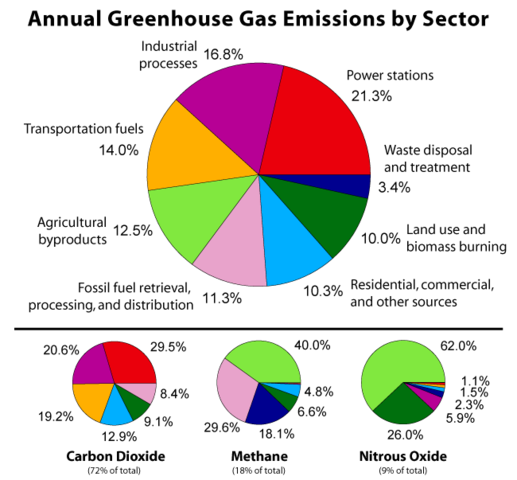
ערכים אלו אמורים לספק תמונת מצב של שנת 2000.
         הפנל העליון מראה את סך הפליטות של  גזי חממה כשהם נשקלים על פי פוטנציאל אפקט החממה שלהם במשך 100 השנים הבאות. זה מורכב מ 72% של  he:פחמן דו חמצני, 18%  he:מתאן, 8%  he:תחמוצת החנקן, ו1% גזים אחרים.
 הפנלים התחתונים מראים את ההשוואה היחסית של כל אחד מהגזים האלה, עם אותים צבעים לסקטורים שונים כמו בפנל העליון. סמגנטים עם תרומה נמוכה מ 1% אינם מסומנים.
 
        Copyright 
        This figure was prepared by  Robert A. Rohde from publicly available data and is part of the Global Warming Art project.
        
         
          Image from Global Warming Art
          This image is an original work created for  Global Warming Art. Please refer to the  image description page for more information.


             | 
           Permission is granted to copy, distribute and/or modify this document under the terms of the  GNU Free Documentation License, Version 1.2 or any later version published by the  Free Software Foundation; with no Invariant Sections, no Front-Cover Texts, and no Back-Cover Texts. A copy of the license is included in the section entitled  GNU Free Documentation License.  http://www.gnu.org/copyleft/fdl.htmlGFDLGNU Free Documentation Licensetruetrue 
            | 


       File usage
       
        The following pages on Schools Wikipedia link to this image (list may be incomplete):


       This file contains additional information, probably added from the digital camera or scanner used to create or digitize it. If the file has been modified from its original state, some details may not fully reflect the modified file.