
File:Holocene Sea Level.png
| |
This is a file from the Wikimedia Commons. Information from its description page there is shown below.
Commons is a freely licensed media file repository. You can help. |
Summary
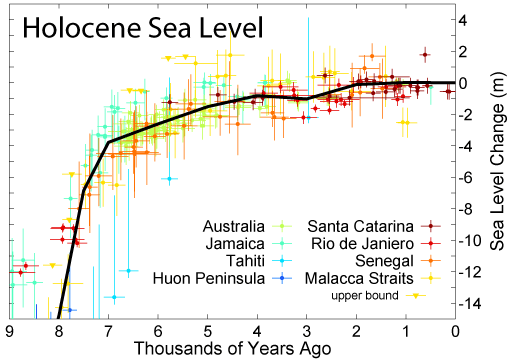
This figure shows changes in sea level during the Holocene, the time following the end of the most recent glacial period, based on data from Fleming et al. 1998, Fleming 2000, & Milne et al. 2005. These papers collected data from various reports and adjusted them for subsequent vertical geologic motions, primarily those associated with post-glacial continental and hydroisostatic rebound. The first refers to deformations caused by the weight of continental ice sheets pressing down on the land, the latter refers to uplift in coastal areas resulting from the increased weight of water associated with rising sea levels. It should be noted that because of the latter effect and associated uplift, many islands, especially in the Pacific, exhibited higher local sea levels in the mid Holocene than they do today. Uncertainty about the magnitude of these corrections is the dominant uncertainty in many measurements of Holocene scale sea level change.
The black curve is based on minimizing the sum of squares error weighted distance between this curve and the plotted data. It was constructed by adjusting a number of specified tie points, typically placed every 1 kyr and forced to go to 0 at the modern day. A small number of extreme outliers were dropped. It should be noted that some authors propose the existence of significant short-term fluctuations in sea level such that the sea level curve might oscillate up and down about this ~1 kyr mean state. Others dispute this and argue that sea level change has been a smooth and gradual process for essentially the entire length of the Holocene. Regardless of such putative fluctuations, evidence such as presented by Morhange et al. (2001) suggests that in the last 10 kyr sea level has never been higher than it is at present.
Copyright
This figure was prepared by Robert A. Rohde from published data, and is incorporated into the Global Warming Art project.
 |
Permission is granted to copy, distribute and/or modify this document under the terms of the GNU Free Documentation License, Version 1.2 or any later version published by the Free Software Foundation; with no Invariant Sections, no Front-Cover Texts, and no Back-Cover Texts. A copy of the license is included in the section entitled GNU Free Documentation License.
|
| This file is licensed under the Creative Commons Attribution-Share Alike 3.0 Unported license. | ||
|
||
| This licensing tag was added to this file as part of the GFDL licensing update.
|
References
- Fleming, Kevin, Paul Johnston, Dan Zwartz, Yusuke Yokoyama, Kurt Lambeck and John Chappell (1998). "Refining the eustatic sea-level curve since the Last Glacial Maximum using far- and intermediate-field sites". Earth and Planetary Science Letters 163 (1-4): 327-342. doi: 10.1016/S0012-821X(98)00198-8
- Fleming, Kevin Michael (2000) Glacial Rebound and Sea-level Change Constraints on the Greenland Ice Sheet, Australian National University PhD Thesis
- Milne, Glenn A., Antony J. Long and Sophie E. Bassett (2005). "Modelling Holocene relative sea-level observations from the Caribbean and South America". Quaternary Science Reviews 24 (10-11): 1183-1202. doi: 10.1016/j.quascirev.2004.10.005
- Morhange, C., J. Laborel, A. Hesnard (2001). "Changes of relative sea level during the past 5000 years in the ancient harbour of Marseilles, Southern France". Palaeogeography, Palaeoclimatology, Palaeoecology 166: 319-329.
File usage
Metadata
Schools Wikipedia and SOS Children
Learning is fun and easy with Schools Wikipedia. SOS Children's Villages cares for children who have lost their parents. Our Children's Villages give these children a new home and a new family, while a high-quality education and the best of medical care ensures they will grow up with all they need to succeed in adult life. Find out more about sponsoring a child.