 |
This is a file from the Wikimedia Commons. Information from its description page there is shown below.
Commons is a freely licensed media file repository. You can help.
|
Summary
| Description |
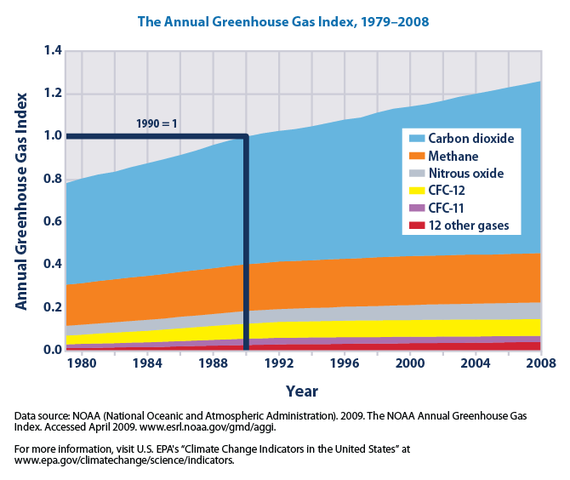
English: The following description is based on the cited source - US Environmental Protection Agency (EPA, 2010): This graph shows changes in the annual greenhouse gas index (AGGI) between 1979 and 2008. The AGGI measures the levels of greenhouse gases in the atmosphere based on their ability to cause changes in the Earth's climate. It includes 17 greenhouse gases - among these are carbon dioxide, methane, chlorofluorocarbons (CFCs), and nitrous oxide. Changes in the AGGI reflect changes in the radiative forcing (i.e., the warming effect) of greenhouse gases in the atmosphere.
EPA (2010): "In 2008, the Annual Greenhouse Gas Index was 1.26, an increase in radiative forcing of 26 percent over 1990 [...] Carbon dioxide accounts for approximately 80 percent of this increase. Of the five most prevalent greenhouse gases shown in [the graph], carbon dioxide and nitrous oxide are the only two whose contributions to radiative forcing continue to increase at a steady rate. By 2008, radiative forcing due to carbon dioxide was 35 percent higher than in 1990. Although the overall Annual Greenhouse Gas Index continues to grow, the rate of increase has slowed somewhat over time. This change has occurred in large part because methane concentrations have remained relatively steady since 1990, and CFC concentrations are declining because most of their uses have been banned."
|
| Date |
1 January 2010 |
| Source |
Climate Change Indicators in the United States: Figure 1. Figure 1. The Annual Greenhouse Gas Index, 1979-2008. Page 18 of PDF. Published 2010. |
| Author |
US Environmental Protection Agency |
Permission
( Reusing this file) |
EPA Climate Change FAQ > Topic > Website > Can I use this graphic/information I found on your website? Topic #: 23002-14698, Date Created: 9/2/2007, Last Modified Since: 6/6/2012: "[...] All of the graphics and information on EPA’s Climate Change Web site, with the exception of the graphics from the Koshland Science Museum of the National Academy of Sciences, and the EPA seal and logo are in the public domain. A credit is appreciated (e.g. Source: U.S. EPA Climate Change Website) [...]"
|
Licensing
| Public domainPublic domainfalsefalse |
|
|
This image (or other media) is a work of an Environmental Protection Agency employee, taken or made as part of that person's official duties. As works of the U.S. federal government, all EPA images are in the public domain.
|
|
| English | eesti | italiano | македонски | Nederlands | polski | português | slovenščina | 中文 | 中文(简体) | +/− |
|
File usage
The following pages on Schools Wikipedia link to this image (list may be incomplete):
This file contains additional information, probably added from the digital camera or scanner used to create or digitize it. If the file has been modified from its original state, some details may not fully reflect the modified file.
You can learn about nearly 6,000 different topics on Schools Wikipedia. SOS Childrens Villages works in 133 countries and territories across the globe, helps more than 62,000 children, and reaches over 2 million people in total. If you'd like to help, learn how to sponsor a child.


