
File:2005food import.png
| |
This is a file from the Wikimedia Commons. Information from its description page there is shown below.
Commons is a freely licensed media file repository. You can help. |
| Description |
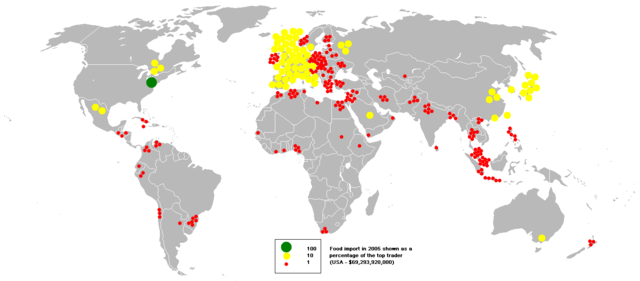
English: This bubble map shows the global distribution of food imports in 2005 as a percentage of the top trader (USA - $69,293,920,000).
This map is consistent with incomplete set of data too as long as the top trader is known. It resolves the accessibility issues faced by colour-coded maps that may not be properly rendered in old computer screens. Data was extracted on 20th June 2007 from http://siteresources.worldbank.org/DATASTATISTICS/Resources/table4_5.pdf Based on Image:BlankMap-World.png |
||
| Date | 20 June 2007 | ||
| Source | english wikipedia | ||
| Author | en:User:Anwar saadat | ||
| Permission ( Reusing this file) |
|

File usage
Want to know more?
Wikipedia for Schools is one of SOS Childrens Villages' many educational projects. SOS Children's Villages helps those who have nothing and no one, giving them back the famly they have lost and bringing them the very best opportunities for a happy, healthy future. Go to http://www.soschildrensvillages.org.uk/sponsor-a-child to sponsor a child.