 |
This is a file from the Wikimedia Commons. Information from its description page there is shown below.
Commons is a freely licensed media file repository. You can help.
|
Summary
| Description |
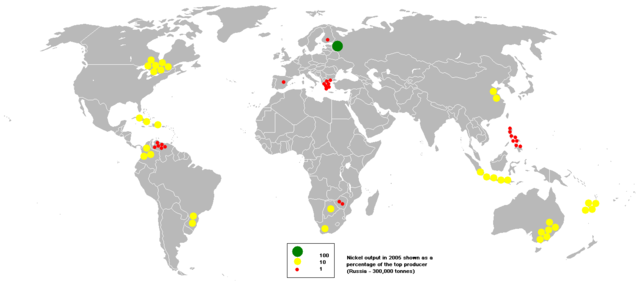
English: This bubble map shows the global distribution of nickel output in 2005 as a percentage of the the top producer (Russia - 300,000 tonnes).This map is consistent with incomplete set of data too as long as the top producer is known. It resolves the accessibility issues faced by colour-coded maps that may not be properly rendered in old computer screens. Data was extracted from http://www.bgs.ac.uk/mineralsuk/commodity/world/home.html on 29th May 2007.
|
| Date |
29 May 2007 |
| Source |
Originally uploaded to the English language Wikipedia ( log). |
| Author |
Anwar saadat ( talk). |
Permission
( Reusing this file) |
 |
Permission is granted to copy, distribute and/or modify this document under the terms of the GNU Free Documentation License, Version 1.2 or any later version published by the Free Software Foundation; with no Invariant Sections, no Front-Cover Texts, and no Back-Cover Texts.
Subject to disclaimers.www.gnu.org/copyleft/fdl.htmlGFDLGNU Free Documentation Licensetruetrue
|
|
File usage
The following pages on Schools Wikipedia link to this image (list may be incomplete):
Wikipedia for Schools was collected by SOS Children's Villages. SOS Children is there for the children in our care until they are ready for independence. Want to learn more? Go to http://www.soschildrensvillages.org.uk/sponsor-a-child


