
File:Isotopes and half-life 1.PNG
| |
This is a file from the Wikimedia Commons. Information from its description page there is shown below.
Commons is a freely licensed media file repository. You can help. |
Summary
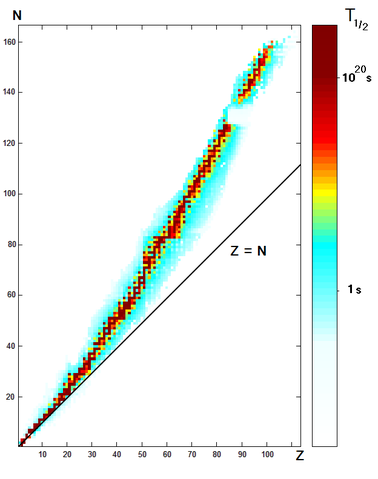
Made with the same data as Image:Isotopes and half-life.PNG.
Graph of the stability of every known nucleus. Plotted as Z (number of protons) versus N (number of neutrons). The colour corresponds to the value of the half-life T½ with a strong log scale, as it varies between  and
and  seconds.
Made by fffred with Matlab.
 |
File:Isotopes and half-life.svg is a vector version of this file. It should be used in place of this raster image when superior. File:Isotopes and half-life 1.PNG
For more information about vector graphics, read about Commons transition to SVG.
|
 |
Licensing
 |
I, the copyright holder of this work, release this work into the public domain. This applies worldwide. In some countries this may not be legally possible; if so: I grant anyone the right to use this work for any purpose, without any conditions, unless such conditions are required by law.
|
File usage
Learn more
Wikipedia for Schools is one of SOS Children's Villages' many educational projects. Thanks to SOS Childrens Villages, 62,000 children are enjoying a happy childhood, with a healthy, prosperous future ahead of them. Find out how you can help children in other countries.