
File:US Labor Participation Rate 1948-2011 by gender.svg
Size of this preview: 640 × 480 pixels.
| |
This is a file from the Wikimedia Commons. Information from its description page there is shown below.
Commons is a freely licensed media file repository. You can help. |
| Description |
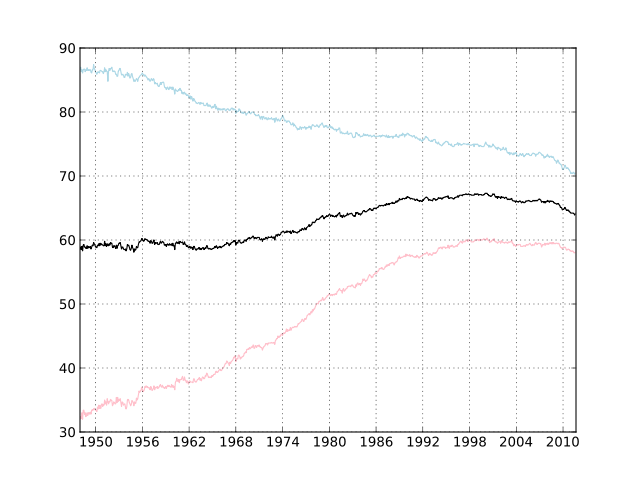
English: Graph of US Civilian Labor Participation Rate from 1948 to 2011 by gender. Men are represented in light blue, women in pink, and the total in black.
|
|||
| Date | 8 October 2011 | |||
| Source | Bureau of Labor Statistics within the United States Department of Labor | |||
| Author | User:Int21h | |||
| Permission ( Reusing this file) |
|
Source code
#!/usr/bin/env python

##
# Create an SVG graph of BLS timeseries data using matplotlib and
# BeautifulSoup.
#

import matplotlib.figure
import datetime
import bs4
import matplotlib.backends.backend_cairo
import string
import urllib2

def main():
        url = 'http://data.bls.gov/timeseries/%s?years_option=specific_years&include_graphs=true&to_year=2011&from_year=1948'
        total_series = 'LNS11300000'
        men_series = 'LNS11300001'
        women_series = 'LNS11300002'

        fig,ax = init_figure()
        add_plot(ax, scrape_bls(bs4.BeautifulSoup(urllib2.urlopen(url % total_series))), 'black')
        add_plot(ax, scrape_bls(bs4.BeautifulSoup(urllib2.urlopen(url % men_series))), 'lightblue')
        add_plot(ax, scrape_bls(bs4.BeautifulSoup(urllib2.urlopen(url % women_series))), 'pink')
        save_figure(fig, 'US Labor Participation Rate 1948-2011 by gender.svg')

##
# Scrape the BLS soup for the data.
#
def scrape_bls(soup):
        table = soup.find_all('table', attrs={'class': 'regular-data'})
        assert len(table) == 1
        table = table[0]
        data = []
        years_lc = [[t for t in r if type(t) is bs4.element.Tag] for r in table.contents[4] if type(r) is bs4.element.Tag]
        for row in years_lc:
                year = int(row[0].text)
                months = [float(t.text) for t in row[1:] if any(c in string.printable and c != ' ' for c in t.text)]
                data.append((year,months))
        return data

##
# Add plot to figure. Extra parameters are passed to
# matplotlib.axes.Axes.plot().
#
def add_plot(axis, data, *args):
        x=[]
        y=[]
        for year,months in data:
                for month,n in enumerate(months):
                        x.append(datetime.date(year, month+1, 1))
                        y.append(n)
        axis.plot(x, y, *args)

##
# Initialize figure.
#
def init_figure():
        figure = matplotlib.figure.Figure()
        axis = figure.add_subplot(111)

        axis.xaxis.set_major_locator(matplotlib.dates.YearLocator(6))
        axis.xaxis.set_major_formatter(matplotlib.dates.DateFormatter('%Y'))

        axis.grid(True)

        return figure,axis

##
# Save figure
#
def save_figure(figure, filename):
        figure.canvas = matplotlib.backends.backend_cairo.FigureCanvasCairo(figure)
        figure.savefig(filename, transparent=True)

if __name__ == "__main__":
        main()
File usage
The following pages on Schools Wikipedia link to this image (list may be incomplete):
Metadata
Want to know more?
SOS Children chose the best bits of Wikipedia to help you learn. By supporting vulnerable children right through to adulthood, SOS Children makes a lasting difference to the lives of thousands of people. Education is a key part of our work, and our schools provide high-quality teaching to the children in our care. There are many ways to help with SOS Children.