
File:Map of NUTS 3 areas in England by GVA per capita (2007).png
Size of this preview: 387 × 480 pixels.
| |
This is a file from the Wikimedia Commons. Information from its description page there is shown below.
Commons is a freely licensed media file repository. You can help. |
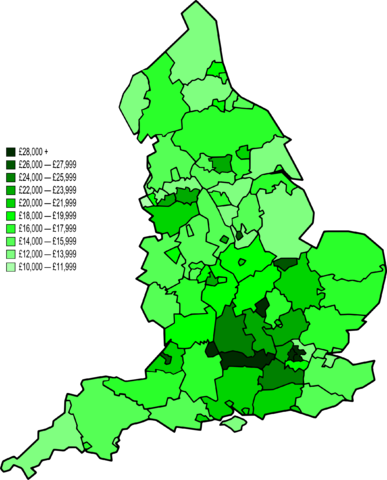
| Description | A map of England divided by NUTS 3 level subdivisons. They are coloured on a ten shade scale of green with light green having the lowest average GVA per capita in 2007 to dark green for the highest. England average is £20,458. |
| Date | 27 May 2010 |
| Source | Most of the map's structure came from Image:BlankMap-EnglandSubdivisions.svg, although several merging and splitting of subdivisons was done by Jolly Janner using Inkscape. The data was from a report by the Office for National Statistics (URL: page 31-33). |
| Author | Kanguole and Jolly Janner. |
| Permission ( Reusing this file) |
Must attribute Kanguole. |
Licensing
 |
Permission is granted to copy, distribute and/or modify this document under the terms of the GNU Free Documentation License, Version 1.2 or any later version published by the Free Software Foundation; with no Invariant Sections, no Front-Cover Texts, and no Back-Cover Texts. Subject to disclaimers.
|
| This file is licensed under the Creative Commons Attribution-Share Alike 3.0 Unported license. Subject to disclaimers. | ||
|
||
| This licensing tag was added to this file as part of the GFDL licensing update.
|
File usage
The following pages on Schools Wikipedia link to this image (list may be incomplete):
Schools Wikipedia facts
Wikipedia for Schools is one of SOS Childrens Villages' many educational projects. SOS Childrens Villages is famous for the love and shelter it brings to lone children, but we also support families in the areas around our Children's Villages, helping those who need us the most. Go to http://www.soschildrensvillages.org.uk/sponsor-a-child to sponsor a child.